
Bar charts are most useful for showing a comparison between different groups of numerical data or to track changes to numerical data over time.
MPAndroidChart is the leading open source free to use native charting library for Android that supports many different chart types including line charts, bar charts, combined line and bar charts, pie charts, scatter plots, candlestick charts, bubble charts and others.
To display a bar chart in your Android app you will need to follow these steps.
- Select a charting library for Android, in this tutorial we will use MPAndroidChart
- Add the dependencies for MPAndroidChart to your project
- Add the bar chart to your activity or fragment layout
- Configure the appearance of the bar chart
- Create the data set to show in the bar chart
- Provide the data set to the bar chart to display in the user interface
Later in this article I will take you through a detailed step by step guide to create different types of bar charts in your Android app using the MPAndroidChart.
We will cover using MPAndroidChart to create a simple vertical bar chart, a horizontal bar chart, a group bar chart and a stacked bar chart.
All the code samples shared in this post are available in the BarChartExamples GitHub repository I have created.
How to Create a Vertical Bar Chart in Android
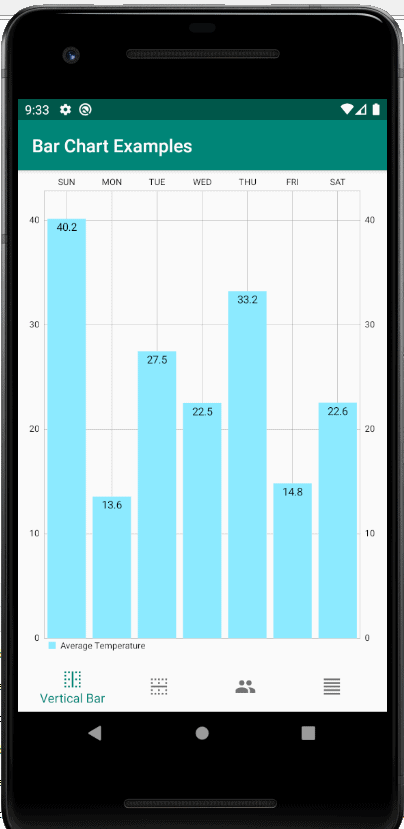
In this section, I will provide a detailed step by step guide on how to use the MPAndroidChart charting library to create a vertical bar chart in your Android app that looks like the screenshot taken from the Android emulator below.
Step 1: Select a Charting Library
For the purposes of this tutorial we will be using the MPAndroidChart library which is a feature rich, open source, free to use charting library for Android.
Quoting directly from the MPAndroidChart GitHub page, the MPAndroidChart library is:
A powerful 🚀 Android chart view / graph view library, supporting line- bar- pie- radar- bubble- and candlestick charts as well as scaling, dragging and animations.
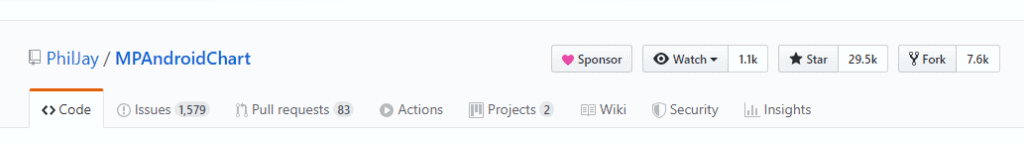
https://github.com/PhilJay/MPAndroidChart
As at the time of writing the official repository for MPAndroidChart on GitHub has 29.5k Stars, 7.6k Forks and 1.1k Watchers.
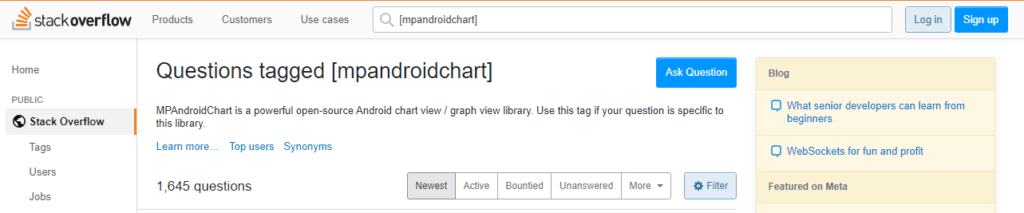
MPAndroidChart is also popular with the StackOverflow community with a total of 1,645 questions asked at the time of writing.
Step 2: Add Dependencies for MPAndroidChart
To retrieve the MPAndroidChart dependencies using Gradle you will need to modify the project level build.gradle file and the app level build.gradle file.
Inside the project level build.gradle file you will need to include a new repository in the allprojects section. See the excerpt from the project level build.gradle file below.
Inside the app level build.gradle file you will need to include the implementation dependency for MPAndroidChart. See the excerpt from the app level build.gradle file below.
If you are using Maven, there are Maven setup instructions on the MPAndroidChart GitHub repo to retrieve the Maven dependencies.
Step 3: Add the Bar Chart to your Activity or Fragment layout
For this tutorial we will be creating a simple vertical bar chart with a single series of data.
You can place the vertical bar chart inside an Activity or Fragment, for the purposes of this tutorial, I have created a Fragment class called VerticalBarChartFragment which will be responsible for initialising the vertical bar chart.
I have also created a layout resource file for this vertical bar chart fragment which will include a LinearLayout with a Bar Chart tag inside of it.
See the code excerpt from the layout resource file for the VerticalBarChartFragment which shows the bar chart placed inside the LinearLayout.
Step 4: Configure the Appearance of the Bar Chart
The next step of the process to create a bar chart in your Android app is to configure how the chart will look in the user interface.
MPAndroidChart offers you the ability to configure the appearance of your charts in multiple different ways that include:
- A chart description, for which you can configure attributes such as the positioning, text, font size and font style. You can also disable the description entirely.
- The appearance of the X Axis, Left Y Axis and Right Y Axis can all be configured through setting the granularity of the labels along the axis, setting minimum and maximum values on the axis, using a value formatter to change the transform the value of the label along the axis
- The positioning of the values within the bars of the bar chart can be made to show above or inside the bar
- A legend can be created and styled in many different ways
For our example I have created a method within the VerticalBarChartFragment class to configure the appearance of the bar chart. See the excerpt from the VerticalBarChartFragment class below.
Inside the configureChartAppearance method the following chart configurations are being made.
- The chart description is set to disabled so that it will not show on the chart
- The chart is being configured to show the values on the bar chart inside the bar rather than above the bar
- A value formatter is set on the X Axis to look up x value in an array of strings that represent the seven days of the week
- Granularity is being set on both the left and right Y Axis to display labels along the axis at 10 units or greater
- The minimum value on the left and right Y Axis is being set at 0
Step 5: Create Your Data Set to Show in the Bar Chart
Now that we have configured how we want the bar chart to look like, the next step is to create the data we want to display into the bar chart.
We will be making use of the following data types when creating our data.
- BarEntry: single entry within a BarDataSet which is made up of an x and y value
- BarDataSet: contains a set of BarEntry’s
- IBarDataSet: contains a set of BarDataSet’s, more than one may exist if there are multiple series of data for the chart
- BarData: contains a set of IBarDataSet’s
For our example, we require only one BarDataSet, the ArrayList of BarEntry’s is constructed with a sequential value of x representing the day of the week and a random floating point value within a particular range representing the average temperature.
The creation of the data is handled in the createChartData() which returns a BarData value containing the full set of data that will be created for the bar chart.
See the code excerpt below which shows the createChartData() method.
Step 6: Provide your Data Set to the Bar Chart
Now that the BarData has been created, the final step is to provide the BarData to the chart so that it can be displayed in the user interface.
See the code excerpt below which shows the prepareChartData() method.
In the prepareChartData() method the following is taking place.
- The setValueTextSize(float) method on the BarData object is being called to set the text size that will be shown inside each of the bars showing the average temperature
- The setData(BarData) method on the chart object is being called to provide the data set that was previously created to the chart object
- The invalidate() method on the chart object is being called to refresh the chart with new data
How to Create a Horizontal Bar Chart in Android
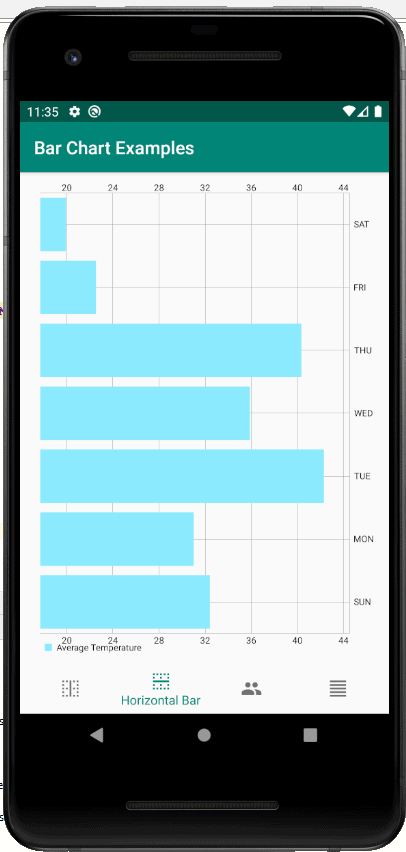
In this section, I will show some code excerpts on how to use the MPAndroidChart charting library to create a horizontal bar chart in your Android app that looks like the screenshot taken from the Android emulator below.
Horizontal Bar Chart Layout Resource Example
Horizontal Bar Chart Fragment Example
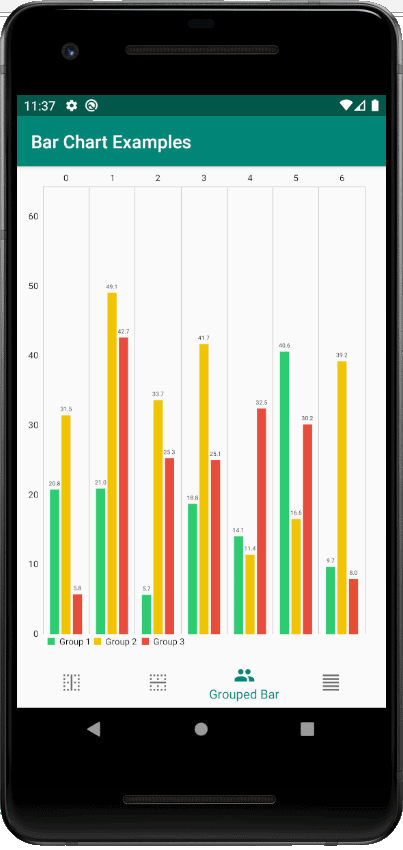
How to Create a Grouped Bar Chart in Android
In this section, I will show some code excerpts on how to use the MPAndroidChart charting library to create a grouped bar chart in your Android app that looks like the screenshot taken from the Android emulator below.
Grouped Bar Chart Layout Resource Example
Grouped Bar Chart Fragment Example
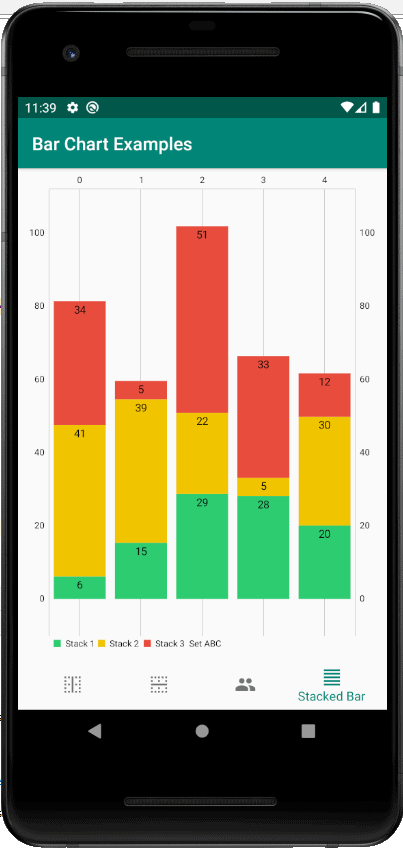
How to Create a Stacked Bar Chart in Android
In this section, I will show some code excerpts on how to use the MPAndroidChart charting library to create a stacked bar chart in your Android app that looks like the screenshot taken from the Android emulator below.
Stacked Bar Chart Layout Resource Example
Stacked Bar Chart Fragment Example
If you are interested in how to create a line chart using the MPAndroidChart library, check out the post I wrote linked below.