

Adding line charts to your Android app offers a great way to present data that is changing over time to your users.
MPAndroidChart is the leading open source, free to use, Android native charting library that supports many different chart types including line charts, bar charts, combined line and bar charts, pie charts, scatter plots, candlestick charts, bubble charts and others.
In this blog post I will show you how to display a line chart in your Android app by following the steps below.
- Add the dependencies for MPAndroidChart to your Android project
- Add the line chart to your activity or fragment layout resource
- Configure the appearance of the line chart
- Create the data set to show in the line chart
- Provide the data set to the line chart to display in the user interface
I have include code samples in this post and I have also created a public code repository on GitHub with the all of the code shared in this post.
How to Create a Line Chart in Android
In this tutorial showing how to create a line chart in Android using the MPAndroidChart library.
We will be creating an app that will retrieve historical prices of a stock using the Yahoo Finance API and display the results in a line chart.
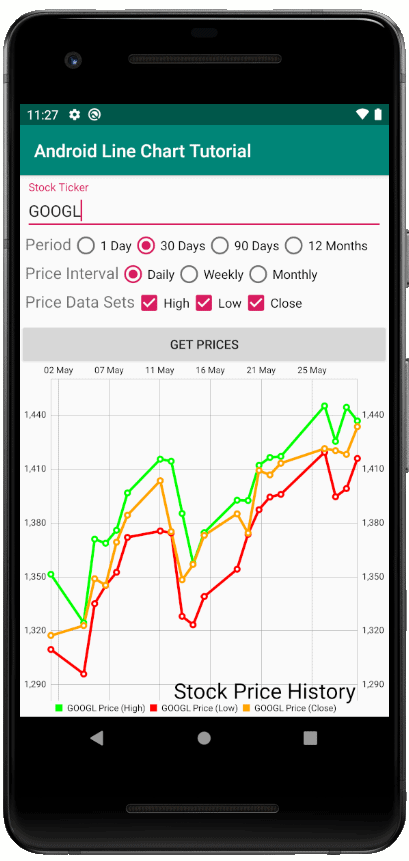
The user will be able to enter a stock ticker, select a historical period of results and showing the high, low and close price of the stock over a particular time interval inside a line chart.
See a sample screenshot below of the app we will be creating.
Step 1: Retrieve the MPAndroidChart Dependencies Using Gradle
The MPAndroidChart library can be retrieved into your Android project using Gradle by updating the app level build.gradle file and the project level build.gradle file.
Starting with the project level build.gradle file located in the root directory of your Android project, you will need to modify the allprojects section and add an entry for maven jitpack as per the code excerpt below.
After this, in order to download the implementation dependency for the MPAndroidChart library you will need to modify the build.gradle file located in the app directory and add the following implementation dependency in the dependencies section.
Because we will be retrieving the stock prices from an API we will also need to add the following dependencies to our app level build.gradle file that will allow us to integrate with the Yahoo Finance API.
- Retrofit – to simplify the implementation of consuming the Yahoo Finance API
- Retrofit GSON Converter – to handle the response from the Yahoo Finance API
- OkHttp3 HTTP Logging Interceptor – to allow us to log and debug interactions with the Yahoo Finance API
In addition to this, Retrofit requires us to use a minimum of Java 8 which will need to be included in the compile options in the app level build.gradle file.
We will be using the TextInputLayout and the TextInputEditText widgets for capuring the stock ticker in our app so we will need to include the Google Material Design dependency in our app level build.gradle as well.
See the excerpts from the app level build.gradle file below.
We will also need to add the permission to use the internet inside the app manifest file. See the sample app manifest file below which includes the internet permission.
Step 2: Adding a Line Chart Widget to Your Activity or Fragment Layout Resource
The second step of this tutorial for creating a line chart in Android requires you to add a line chart widget from the MPAndroidChart library into your Activity or Fragment layout resource file.
In my example I will be using an Activity, please see the layout resource file below for the main Activity that includes a line chart widget inside a LinearLayout.
We will also take this opportunity to add the following widgets to the activity or fragment layout resource to display above the line chart widget.
- A TextInputLayout and TextInputEditText from the Android Material Design library for capturing the stock ticker
- A RadioGroup with three RadioButtons for selecting the period that we want to retrieve the historical stock price over with the options of 1 day, 30 days, 90 days and 12 months
- A RadioGroup with three RadioButtons for select the price interval we want to display the low, high and close price of the stock in the line chart with the options of Daily, Weekly and Monthly
- Three CheckBoxes for selecting which price data series we want to display in the line chart with the options of High, Low and Close stock prices
- A Button with the text “Get Prices” that will trigger the request to the Yahoo Finances API to retrieve the stock prices
See the updated Activity layout resource file below.
Step 3: Configure the Appearance of the Line Chart
In the third step of this tutorial we will configure the appearance of the line chart to be shown in the Android app.
MPAndroidChart offers a number of different ways to customise the appearance of the a line chart such as the chart background, chart description, the appearance of the X & Y axis and many others.
See the code sample below in the main Activity class where I have written the configureLineChart() method which is called in the onCreate(…) method to customize the appearance of the line chart.
In the configureLineChart() method we create a Description object with the label “Stock Price History” to be shown in the line chart with a text size of 28.
Also in the configureLineChart() method we also retreive the X Axis from the line chart and add a ValueFormatter to the X Axis to allow us to display the date in the X Axis using a String format by using a SimpleDateFormat object to convert the unix time in milliseconds to show the day and month.
If you would like to customise the appearance of your line chart in other ways I would recommend you have a look at the documentation available online at the link below for the MPAndroidChart library.
Step 4: Create the Data Set to Show in the Line Chart
In the forth step of this tutorial for displaying a line chart in an Android app we will create the data set to be shown inside the line chart.
In this step of the tutorial we will integrate with the Yahoo Finance API to retrieve the historical stock price data to display inside the line chart. We will allow the user to show up to three series of data in the line chart, the lowest price of the stock for the given interval, the highest price of the stock for the given interval and the close price of the stock for the given interval.
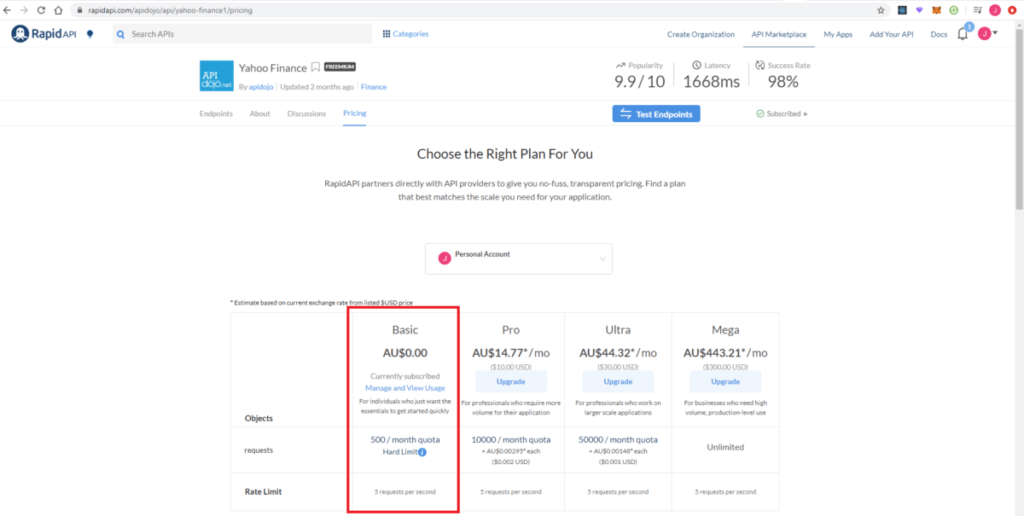
First we will need to get access to the Yahoo Finance API documentation and create an API key. The Yahoo Finance API is available on the RapidAPI platform and you will need to create a RapidAPI account to get access to the Basic subscription for the Yahoo Finance API for free which gives up a free quota of 500 calls per month.
Once you have create a RapidAPI account check out the documentation for the Yahoo Finance API at the following link.
https://rapidapi.com/apidojo/api/yahoo-finance1/endpoints
We will be using a GET method call on the “/stock/v2/get-historical-data” endpoint to retrieve the stock price data. We will need to pass the the API host and API key as headers to the GET request. We will need to pass the following as query parameters in the GET request.
- The stock ticker
- The price interval
- The value of “history” as the filter
- The unix time stamps for the start time and end time period we want to retrieve stock price data for
Once you have subscribed to the Yahoo Finance API via RapidAPI and retrieve your API key, next we will set up our Android project to use Retrofit to integrate with the Yahoo Finance API.
We will need to create a class for handling the response to the API. See the code sample for the HistoricalDataResponse class that will be used to parse the JSON payload in the body of the API response using the Retrofit GSON converter.
If you would like to learn more about how GSON works I would recommend you read the Android JSON tutorial I wrote which has a detailed section covering GSON.
Next we will need to create the interface Retrofit will use to integrate with the Yahoo Finance API. See the code sample below containing the Retrofit interface for the Yahoo Finance API.
Next in the Activity or Fragment class we will write a method called setupApi() to allow us to connect to the Yahoo Finance API using Retrofit.
See the code sample below where I have created the setupApi() method which is invoked in the onCreate() method of the Activity to set up the interface with the Yahoo Finance API using Retrofit.
For the final part of this step of the tutorial we will invoke the Yahoo Finance API and using the response from the API we will create three ArrayLists of Entry objects made up of the timestamp and stock price values for the low, high and close stock price series. The MPAndroidChart library uses a List of Entry objects to set the data on the line chart.
See the code excerpt below from the main Activity class containing the code for invoking the Yahoo Finance API and create the three ArrayLists of Entry objects to provide to the MPAndroidChart line chart.
In the onCreate() method of the Activity we will will add an OnClickListener to the “Get Prices” Button to run the getStockData() method to be used for calling the Yahoo Finance API.
In the getStockData() method we will use the current system time as the end time for obtaining the stock price historical data and calculate the start time by subtracting the time in seconds based on the option selected for the time period in the RadioGroup and RadioButtons.
Next we will retrieve the interval for showing the stock prices using the RadioGroup and RadioButtons for the stock price interval.
If you would like to learn more about using RadioGroups and RadioButtons in Android app development check out the tutorial I wrote on this linked below.
Next we will invoke the Yahoo Finance API passing the various query parameters as requested in the documentation. We will add callbacks to this request handling the successful and failure response.
In the case of the successful response we create three empty ArrayLists for the three data series for low, high and close stock prices. Then we use the API response and loop through all of the items in the “prices” array and add new Entry objects to the ArrayLists using the x value as the date and the y value as the low, high or close stock price.
MPAndroidChart will throw an error if the Entry values in the List are not sorted. To prevent this I have used a comparator to sort the values in each of the ArrayLists by the date value.
See the code sample below from the main Activity class, that shows how to interact with the Yahoo Finance API and create multiple ArrayList of Entry objects containing the stock price data.
I have gone through the Retrofit parts of this tutorial really briefly, if you would like to get a more indepth understanding of how to use Retrofit in Android app development I would recommended reading the post I wrote linked below.
Step 5: Provide the Data Set to the Line Chart to Display in the Activity or Fragment
In the fifth and final section of this tutorial for creating a line chart in Android we will set the data on the line chart using the three ArrayLists we creating in the previous step containing Entry objects.
In the MPAndroidChart library data is managed in the line chart widget using the LineDataSet, ILineDataSet and LineData clases.
LineDataSet represents a single series of data. Methods on the LineDataSet object can be used to change the appearance of a series of data when shown in the line chart. The LineDataSet requires a list of Entry objects as well as a label for the series of data.
A List of ILineDataSet objects are is used to group multiple LineDataSet objects to show on a single line chart.
The LineData takes the ILineDataSet object in the constructor and is used for setting one or more series of data onto the line chart by calling the setData(LineData) method on the LineChart. Once you have updated the data in the line chart call the invalidate() method on the LineChart to refresh the data.
See the code sample containing the setLineChartData(…) method which is used for setting the data on the line chart.
If you are interested in how to create a bar chart using the MPAndroidChart library, check out the post I wrote linked below.